This is the full version of the article. Click here to return to the blog's home page.
An Open Letter to Governor Jay Inslee
Serious flaws in Vancouver oil-by-rail terminal risk analysis create false impression of safety
Entry 16: June 16, 2016. 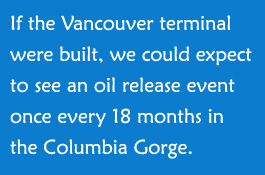
The recent derailment and fire of a train carrying crude oil in Mosier, Oregon led me to question the reasoning in the draft environmental impact statement for the Vancouver Energy oil terminal and conduct an independent review. What I found was a number of flaws, errors, and omissions in the risk analysis. The letter below to Washington Governor Jay Inslee explains what I found. My own independent risk analysis supporting the conclusions in the letter can be found here. (Microsoft Excel read-only workbook)
Dear Governor Inslee,
I wish to present information that calls into question the risk analysis for the Tesoro-Savage Vancouver oil terminal draft environmental impact statement (DEIS). A few days ago we had a derailment and fire in Mosier, Oregon that led me to create an analysis to explain how an accident such as this could happen so quickly given that the consultants preparing the DEIS report thought it could only happen about once every 35 years. My conclusion is that under the current levels of oil transport, an event would happen about once every 30 months. It would shorten to once every 18 months in the Columbia Gorge if the Vancouver oil terminal is approved, and somewhere along the entire route to North Dakota every 45 days an oil release could be expected. I’ll go into more detail below. While I am not a professional statistician, I am trained as a chemical engineer and have sufficient background to understand the concepts involved.
Mainline Management, the authors of Appendix E in the DEIS, used a bottom-up risk analysis. Their approach was to create a model for all the things that could go wrong and assign probabilities to each of them, then arrive at a final estimate by combining them together. This method has drawbacks, however. It requires that all the important factors are accounted for, and that accurate estimates of each one are available. Small errors in one or more factors could mushroom into a larger error, and missing factors could completely change the outcome. Because it’s a complex model, it invites the introduction of bias. Another problem with this method is that changes in the operating regime could happen at any time and invalidate the assumptions used.
To validate their conclusion, I used a top-down risk analysis. This approach looks at data for all shipments in the US and doesn’t apply special conditions. It simply says, “If we know the failure rate for hazardous material shipments in the US, what can we expect for the amount of traffic this terminal will accept?”
My analysis needs only the following factors: The industry-quoted failure rate of 0.0023% for hazardous-materials shipments by rail, the average trip length for a shipment, the distance the shipment travels through the Columbia Gorge, and the number of shipments per month. I will send you this model in an Excel spreadsheet by email. Note that unlike the uncertainties of the bottom-up analysis, these are all well-known numbers, not subject to bias. The result of this calculation is displayed in Figure 1 below:
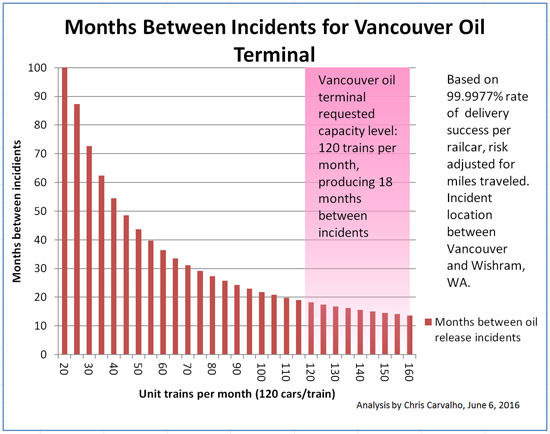
Figure 1. Estimated
months between incidents for Vancouver Energy facility from industry data
The Mosier derailment was an event that spilled 1,000 barrels of oil. The DEIS indicated that a spill of this size would happen every 35 years or so:
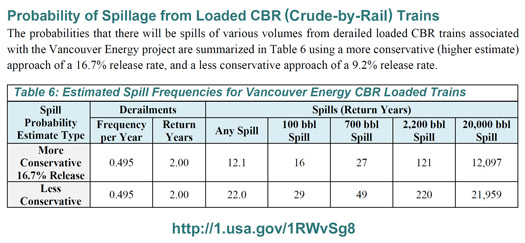
Figure 2. Estimated spill
frequencies from Vancouver DEIS, Appendix E page 14.
The figure of 35 years was arrived at by plotting the return years (years between events) and spill sizes from the more conservative data in the above table on a logarithmic scale and finding the appropriate number of years for a 1,000-barrel spill.
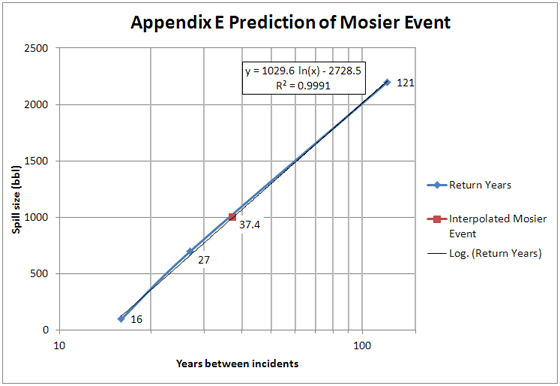
Figure 3. Estimated
frequency of Mosier spill event
What may not be readily apparent is that the DEIS data assume the Vancouver terminal would be in operation for the Figure 3 risk levels. Today, crude-by-rail traffic in the region is about 64% of the Vancouver terminal volume so the same methodology would predict the Mosier event would happen only once every 58 years. Clearly something is wrong with the conclusion reached in the DEIS risk study. Let’s go into some of the discrepancies and omissions I found in my review.
In Appendix E, Table 8 says 63 tank cars derailed and five had spillage in the Lac-Mégantic disaster. This is not in agreement with the Transport Canada report on this accident at http://bit.ly/1Q6th9w which contains the following statement:
“Almost every car that derailed was breached, some in multiple areas, including shells, heads, top and bottom fittings, and pressure relief devices. The exact location and extent of the damage varied depending on the orientation and speed of the cars during the derailment.”
The full report (http://bit.ly/1UW4LDK) indicates on page 39:
“1.18.2 Tank car damage assessment
An assessment of the damage sustained by the 63 derailed tank cars revealed that 59 (94%) were breached and released crude oil due to tank damage. The location and extent of the damage varied, depending on the orientation and speed of the cars during the derailment. Many cars sustained damage in multiple locations (Table 3).”
In addition, the Lac-Mégantic disaster released a total of 37,738 barrels of oil. This is twice the amount of the worst-case-discharge amount of 18,295 barrels reported in Appendix E. This error needs to be corrected. In addition, the Mosier event should be added to the list of accidents in Table 18 of the appendix.
Table 18 of the appendix states that the Casselton, ND accident released “>9,524” barrels. The US Pipeline and Hazardous Materials Safety Administration report to Congress on oil train safety (http://1.usa.gov/1OhnAF4) indicates that 11,340 barrels were spilled. The accident was from a BNSF train, so this underestimate is suspicious. We also know that three of the four authors who wrote the risk analysis for the Energy Facility Site Evaluation Council (EFSEC) are former executives of BNSF Railway, the company that would transport the oil to Vancouver. BNSF in the past has paid these consultants for other work and there is the possibility of a conflict of interest, mentioned in a number of recent press articles.
The authors of the risk analysis state that in the last 15 years, there was a significant reduction in the percentage of derailed hazmat cars that release hazardous materials (page 32). However, the Lac-Mégantic disaster bucks this trend significantly. The authors apparently disregarded the data from this disaster because it was in Canada. However, the train originated in the US and an argument can be made that it is a valid member of the population for these statistics and cannot be excluded simply because of an arbitrary geographical border. According to NBC News (http://nbcnews.to/1wxHk7H), data from the federal government indicate that American oil trains spilled crude oil more often in 2014 than in any year since the federal government began collecting data on such incidents in 1975. Crude oil transport is not obeying historical trends for hazardous cargo.
Another possibly more significant weakness in this risk analysis is that large oil-by-rail shipments are a relatively new phenomenon. Indeed, the authors note it is an important assumption in three sections of Appendix E:
“There are not enough CBR (crude-by-rail) –specific data to conduct a robust analysis with respect to estimating spill volumes from tank car outflows.” (page 25)
“This analysis assumes that freight cars are proxies for CBR tank cars and that the distribution of derailed cars in a unit train would be analogous to those of a manifest train (i.e., one with a variety of cargo in freight cars). There are not enough data on CBR derailments and spills to do a comprehensive analysis.” (page 33)
“The derailment analyses for federal and Washington are based on all varieties of freight trains, not necessarily crude by rail (CBR) trains. The reasoning behind this approach is that [there] are not enough data on CBR train derailments alone to allow for a statistically-valid analysis. CBR traffic has been underway at a large scale only in the last few years. In addition, derailments occur regardless of the cargo content of the freight cars. Track conditions, rail operating procedures, and other factors unrelated to cargo content are the factors that determine derailment frequencies and locations.” (emphasis added, page 11)
It is not yet proven that cargo content does not determine derailment frequency or location. It’s a common assumption in the rail industry with very little evidence published on it. Cargo content can play an indirect role in derailment frequency. When oil is transported in unit trains, these trains are often longer than mixed-manifest trains. Available data indicate that the number of cars involved in a derailment increases as the length of the train increases.
[1] What is known is that the severity of a derailment depends on the length of the train and also on the type of cargo. In a unit train derailment, the probability of a tank car being punctured is higher than it would be on a train with mixed cargo because all cars are the same. Therefore, a car that impacts the one in front or behind it will be impacting a car with oil inside. Even though the authors state that derailment frequency has decreased in recent years, Bakken crude oil is also far more volatile and causes increased fire and explosion hazard when an accident does occur.The authors base their entire risk model for the more conservative oil release rate in Figure 2 above on the record of derailments from 1975 to 2014. However, crude-by-rail shipment volumes have only been significant for four years of that timeframe, according to the Association of American Railroads.
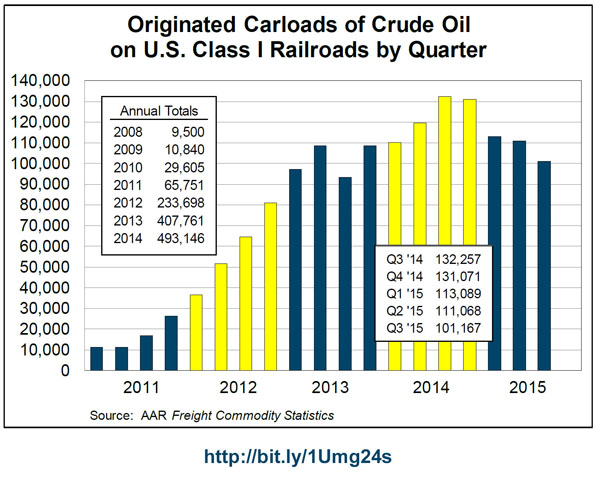
Figur
The lack of data on large oil shipments makes the entire analysis highly suspect. Because of this, there is no way to know if we can create reliable trends from recent information. There isn’t enough of a track record yet.
Furthermore, the authors do not examine the existing data to calculate confidence intervals quantifying the variability in the limited number of spill reports we have and the chances future spills will fall within these limits of variability. In the absence of confidence intervals there is no way to know the accuracy of the report’s quoted risks. My own review of the existing spill data indicates there are not enough events to know if it follows a normal distribution and it’s not possible to produce accurate confidence intervals until more spills happen. If I were an author, I would specifically note this issue.
The derailment risks for Appendix E are calculated using a route from Sandpoint, Idaho to Vancouver. By doing so, the risk from North Dakota to Idaho is excluded from the analysis. The average length of a hazardous materials shipment which is the basis for the 99.9977% delivery reliability figure is 578 miles. The length of the Columbia Gorge is only 96 miles, which cuts the risk almost by a factor of six. However the distance from Vancouver to North Dakota is 1178 miles, so the risk along the entire route is about twelve times that of the Gorge, meaning a release every 45 days. This means Washington’s approval of the terminal will significantly impact residents of other states with derailment risk, a fact completely overlooked by the authors.
To conclude, the consequences of an accident from the Vancouver terminal could be grave. We shouldn’t trust only one analysis to make a decision, especially with the flaws demonstrated here. EFSEC has a responsibility to protect the public and it should commission several independent analyses using different approaches to assess the risk from more than one viewpoint. It should also do a thorough audit of Appendix E using an independent risk analysis consultant. Looking at the risks in a top-down way as I’ve done indicates there is much greater risk to lives, property, and the environment than the applicant believes. The recent Mosier derailment and its agreement with the top-down model’s estimated frequency bolsters that conclusion. Crude-by-rail transport is so new that we have no accurate way to estimate risk today, and our regulatory and reporting systems haven’t kept pace. Knowing what I do, were I making the decision I would deny the current application and wait at least five years before considering any more of them.
Sincerely,
Chris Carvalho
References:
[1] Liu, Xiang et al. “Analysis of Causes of Major Train Derailment and Their Effect on Accident Rates.” Transportation Research Record: Journal of the Transportation Research Board, No. 2289, Transportation Research Board of the National Academies, Washington, D.C., 2012, pp. 154–163. < http://bit.ly/1U5NgXk >
Chris Carvalho has a Bachelor of Science degree in chemical engineering from the University of California at Berkeley. He is a photographer and blogger on public policy, environmental, and conservation topics.